
ERA5 Surface Temperature Mapping Tool
ERA5 2 m air temperature maps are widely used to analyse temperature variability, identify heatwaves and cold spells, investigate climate variability, and distinguish regional and local temperature patterns. They support climate monitoring, extreme temperature assessment, urban climate and heat island studies, land–atmosphere interaction research, surface energy balance studies, agriculture, renewable energy, air quality and atmospheric chemistry research, wildfire risk assessment, environmental consulting, and operational decision-making. They are also invaluable for scientific research, university teaching, scientific publications, and communicating weather and climate information through clear, high-quality visualizations.
Create high-quality ERA5 surface temperature maps and animations from 2 m air temperature NetCDF files in just a few minutes, with extensive customization of colour palettes, map appearance, and export options.
Learn how to create ERA5 surface maps and animations — without coding.
Download ERA5 Surface Temperature Mapping Tool
Full professional functionality. All features and export options available. One-time purchase — no subscription. Use your downloaded version indefinitely.
Explore the tool with basic features. Up to 5 maps with watermark. Three color maps available. PNG and GIF export only.
Advanced Visualization
- Transform ERA5 2 m air temperature NetCDF datasets into high-resolution maps and animations with fully customizable visualization settings.
- Customize geographic domain, time range, map titles, colour palettes, isotherm overlays, animation speed, and export formats, including PNG, PDF, GIF, and MP4.
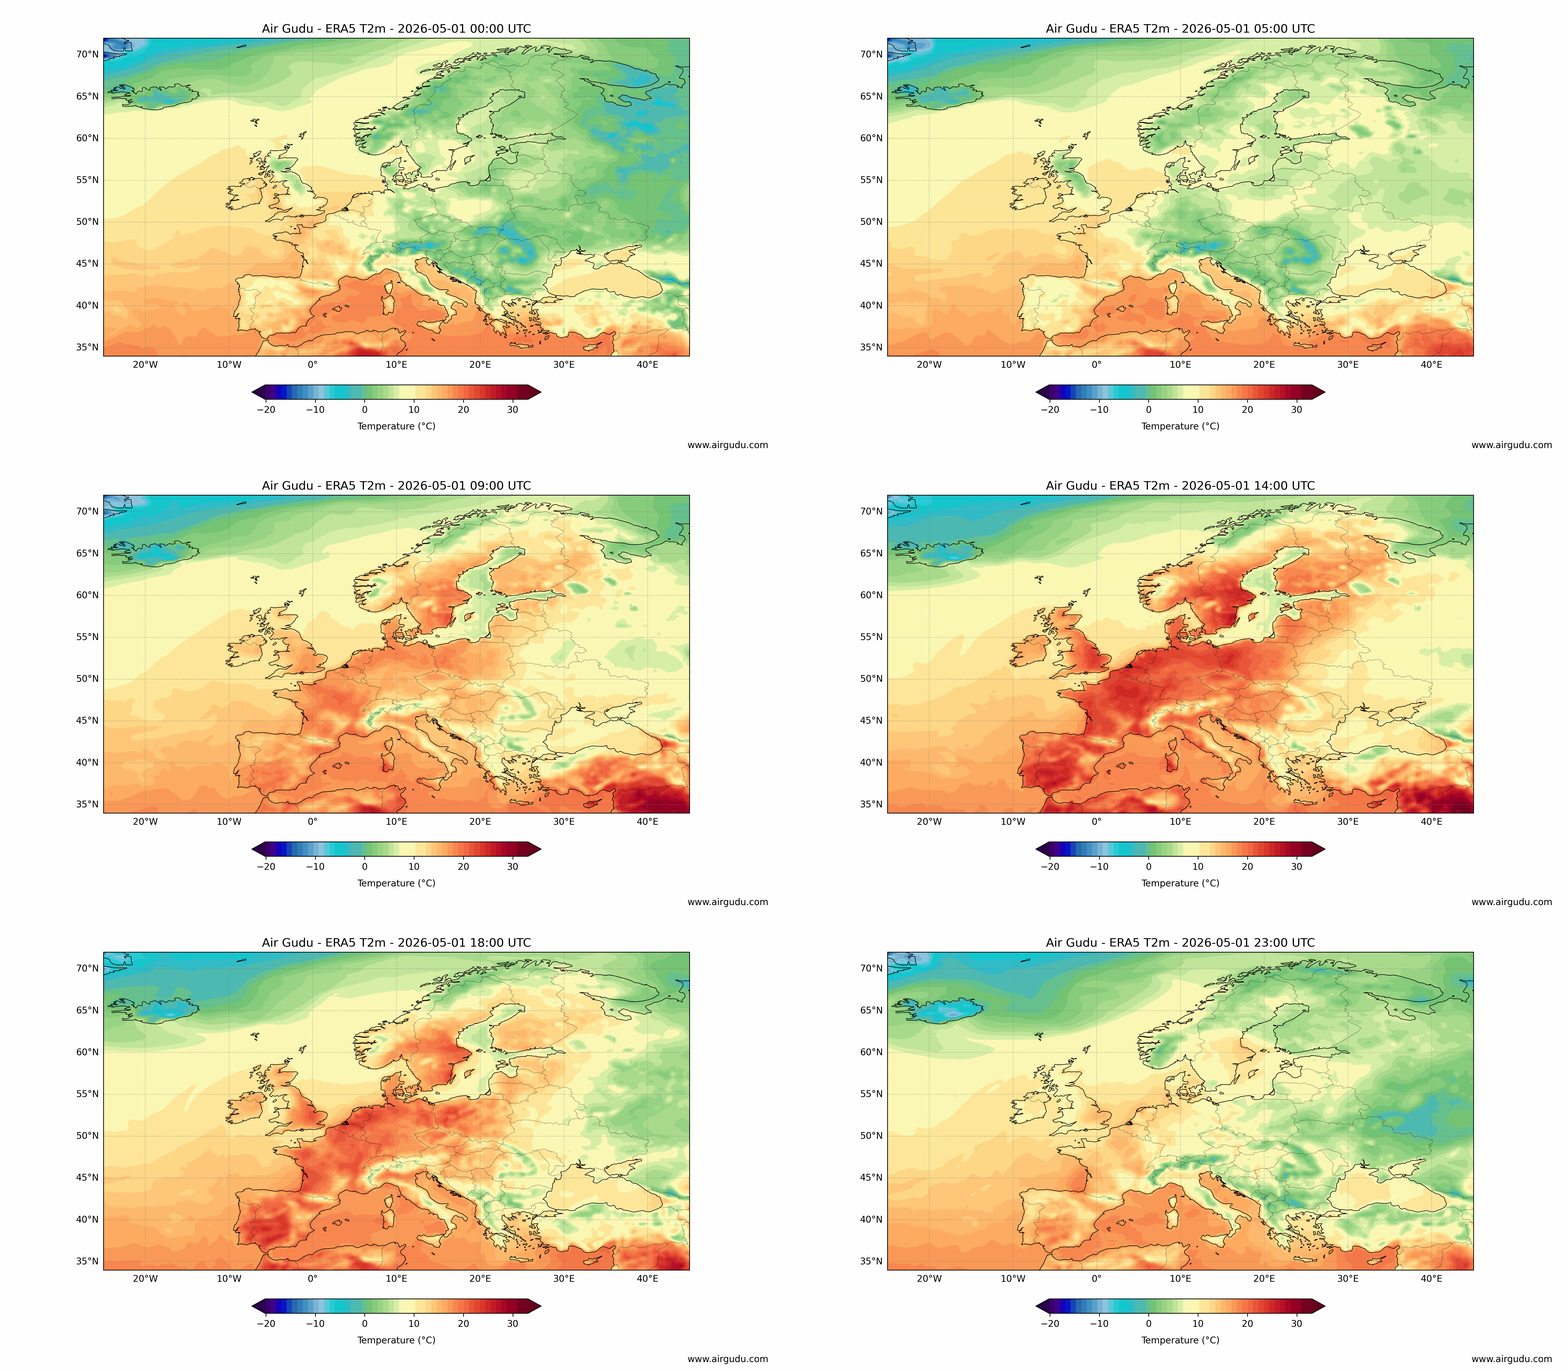
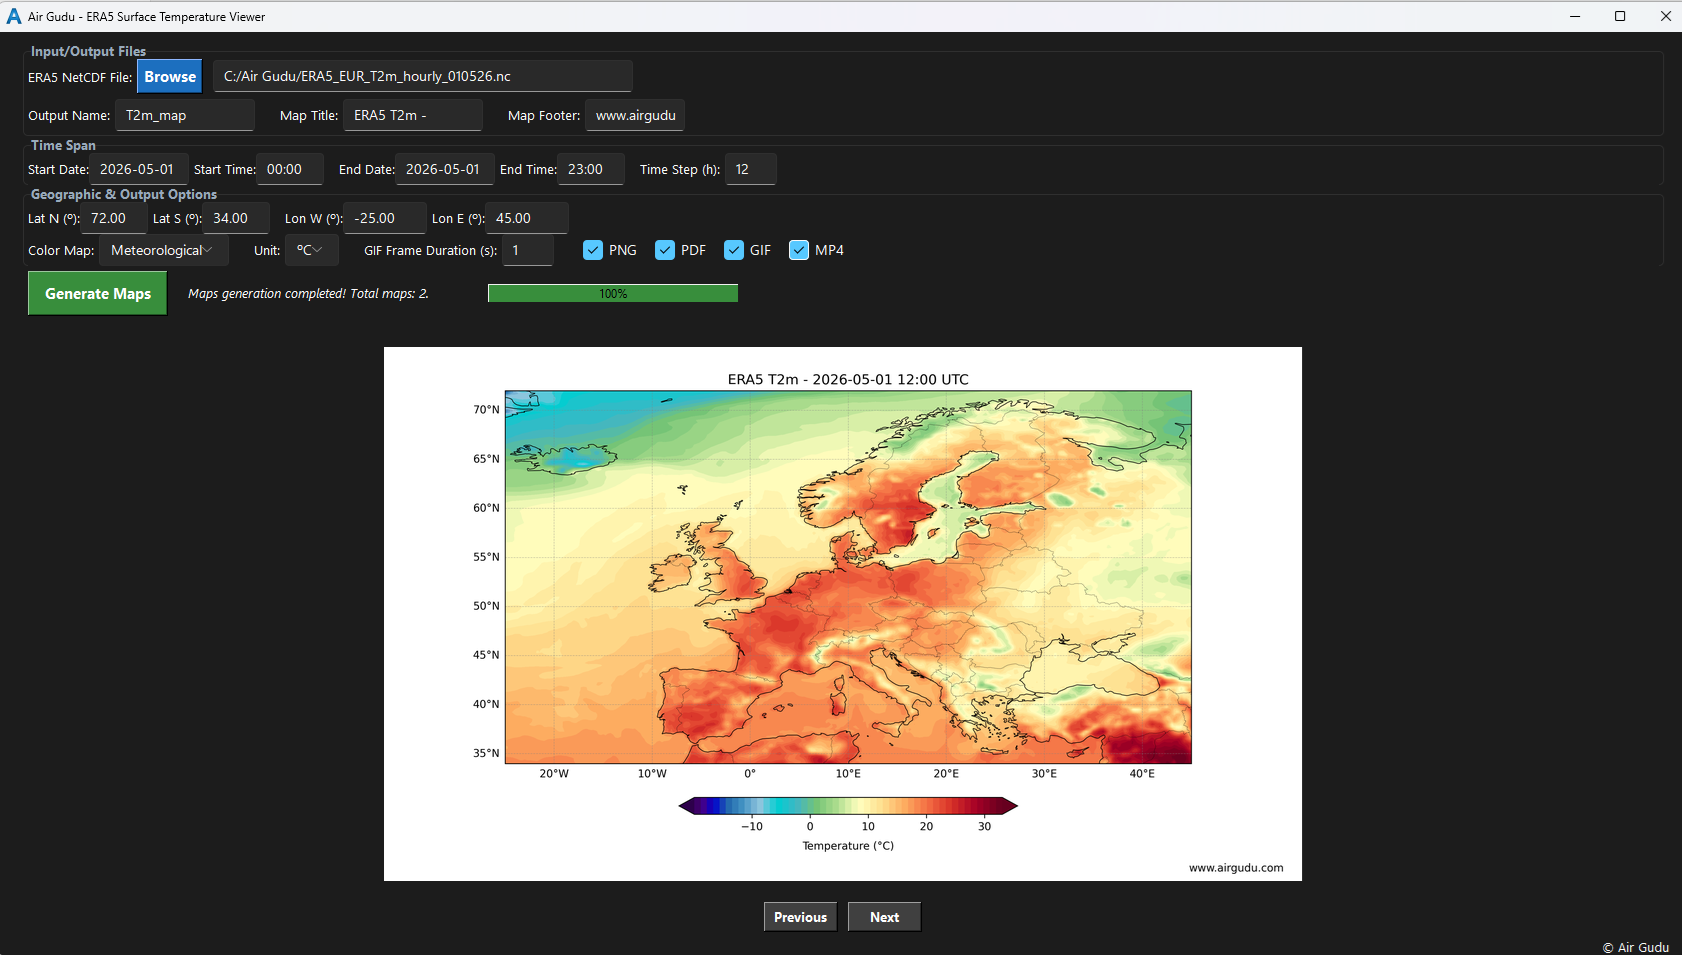
Graphical interface for generating customizable ERA5 2 m air temperature maps and animations.
Offline Capability & Performance
Process large ERA5 2 m air temperature NetCDF datasets entirely on your local computer. All maps and animations are generated offline, delivering fast performance, complete data privacy, and full control over your workflow.
Technical Specifications
Designed for scientific reliability and transparency. Full control of data handling, processing parameters, and reproducible outputs.
- Operating System: Windows 10/11 (64-bit).
- Input format: NetCDF (CF-compliant).
- Supported datasets: ERA5 hourly data on single levels and ERA5-Land hourly data.
- Supported variables: 2 m air temperature (t2m).
- Spatial configuration: User-defined geographic domain.
- Native spatial resolution: 0.25° × 0.25° (ERA5) / 0.1° × 0.1° (ERA5-Land).
- Temporal coverage: 1940 – Present.
- Output products: Static surface temperature maps (PNG, PDF) and animated surface temperature visualizations (GIF, MP4).